


Other posts you might be interested in
View All Posts
Supplier Compliance
4 min read
| January 2, 2020
Maintaining Service Excellence as a Major Supplier with Stratas Foods
Read More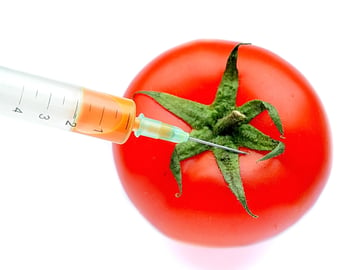
Food Industry
6 min read
| September 20, 2018
Food Fraud: Reducing the Risks and Ensuring Food Safety
Read More
8 min read
| May 16, 2023